
Why Materials Matter
Every time we take the bus, buy a new phone, or eat a meal, we use natural resources. Minerals, fossil fuels and biomass support almost every aspect of daily life and economic activity. Yet the scale of this reliance often goes unnoticed. The extraction and processing of natural materials account for over 55 percent of global greenhouse gas emissions, 90 percent of biodiversity loss due to land use, and up to 40 percent of air pollution-related health impacts (Global Resources Outlook 2024). These numbers show that understanding material use is not just about economics or infrastructure. It is essential for tackling climate change, protecting ecosystems, and improving public health.
Why This Database Is a Research Tool Worth Using
During my internship at the International Resource Panel (IRP), I was introduced to a tool that helps make global material flows visible. The IRP’s Global Material Flows Database provides detailed information on the natural resources extracted, used, traded, and consumed across countries and regions. I was surprised by how useful the database could be for students working on their theses, as well as for researchers and analysts in development, public policy, and environmental studies. It could even be valuable for educators looking to present a clearer picture of the material drivers behind today’s environmental challenges. Yet in my view, its value is not widely known or used enough in academic settings. This blog, therefore, aims to introduce the database, explain, and demonstrate how it can support academic work, particularly in the fields of sustainability, development, and policy research.
Why Track Material Use?
Natural resources like minerals, fossil fuels, and biomass form the basis of almost everything we do. They make it possible to build energy systems, manufacture goods, and carry out daily activities, from commuting to eating out. Monitoring how these materials are used matters because their extraction and processing are closely tied to some of today’s most urgent global challenges, including climate change, biodiversity loss, and air pollution. This makes resource monitoring essential for addressing environmental impacts, protecting ecosystems, and improving well-being.
The IRP’s Global Material Flows Database plays a key role in monitoring global resource use. It was developed to help reporting progress toward SDG 8.4 (resource efficiency) and SDG 12.2 (sustainable use of natural resources), and it now provides the core data used for official SDG reporting. Understanding material use is not only essential for tracking these global goals but also for achieving the broader objective of decoupling human wellbeing and economic growth from environmental degradation.
What the Database Tracks
Understanding how material use affects sustainability starts with a few key indicators included in the Database, which describe how resources are extracted, traded, and
consumed across countries. These indicators might sound technical at first, but they offer a clear and practical picture of a country's or region's material use.
Domestic Material Consumption (DMC) is one of the most widely used indicators. It measures the total amount of materials (biomass, fossil fuels, metals, and non-metallic minerals) that are extracted and used within a country’s borders. The formula is straightforward: Domestic Extraction plus Imports, minus Exports. In other words, it shows how much material is directly handled within the economy. DMC is important because it reflects domestic pressure on resources and gives an idea of the potential for long-term waste generation.
Material Footprint (MF) takes a broader perspective by focusing on the total resources needed to meet a country's consumption. It is a demand-based indicator that accounts for materials extracted in other countries to produce goods and services that are eventually imported. The formula is Domestic Extraction plus the Raw Material Equivalent of Imports, minus the Raw Material Equivalent of Exports. MF provides a sense of the environmental impacts of consumption that occur outside a country’s territory.
Physical Trade Balance (PTB) helps identify a country’s dependence on imported materials relative to its exports. Unlike traditional trade balances that focus on monetary value, PTB looks at the physical quantity of materials (imported minus exported). This is important for understanding trade-related environmental impacts and the often-unseen flows of resource use in global trade.
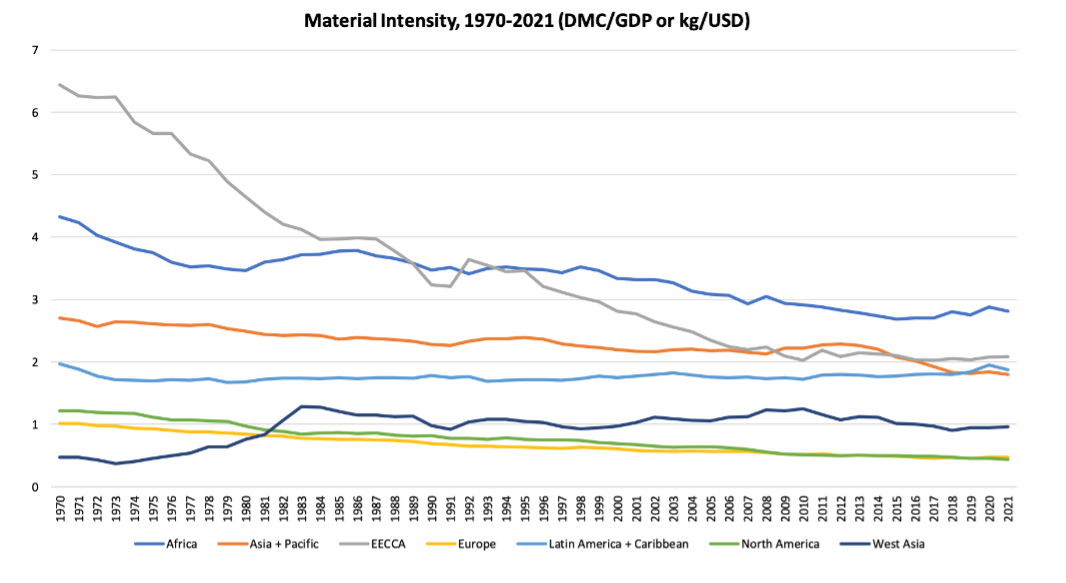
The database also includes indicators related to economic efficiency. Material Intensity shows how many tonnes of materials are needed to generate one unit of economic output. Material Productivity, on the other hand, reflects how much economic value is created per tonne of material used. These indicators can help assess how efficiently an economy uses its resources over time.
What You Can Learn and How to Use It
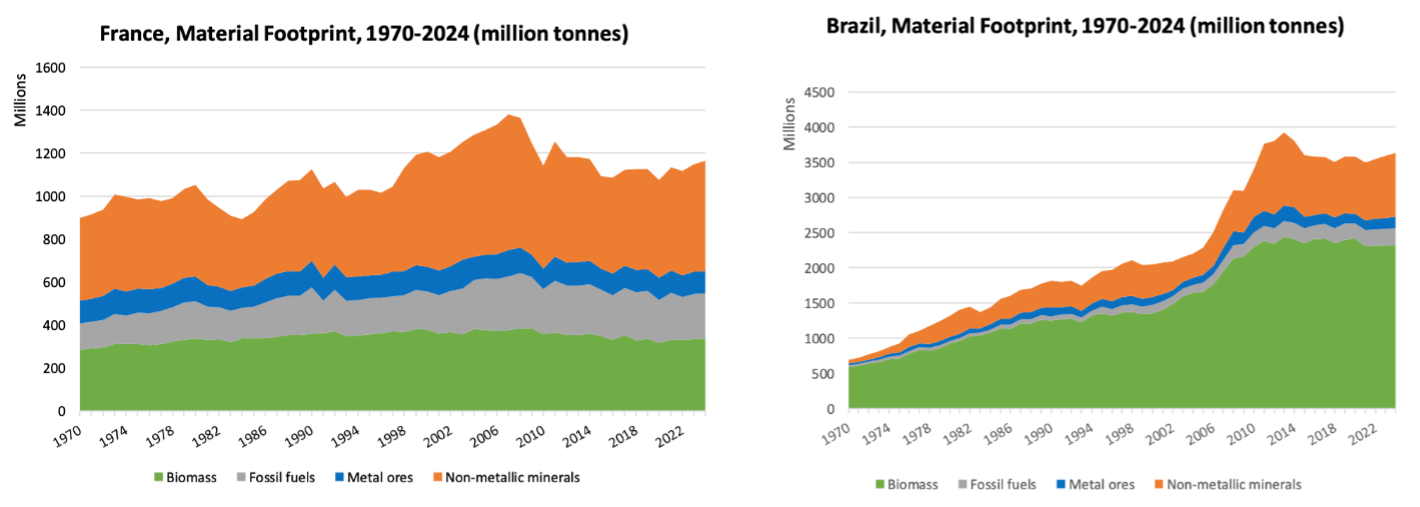
The value of the Material Flows Database becomes clearer when you start exploring specific country or regional data. The visualizations are available on the Global Material Flows Database as well as on materialflows.net and the SCP-HAT website, making it easy to interact with the data. For example, when comparing the material footprint (MF) of France and Brazil from 1970 to 2024, we see two very different trends. Over the past few decades, France’s MF has oscillated within a range from ca. 900 to 1200 million tonnes (with a notable increase in the decade of 2000), with a consistent reliance on fossil fuels, non-metallic minerals and biomass. Brazil, on the other hand, has seen a steady increase (from ca. 500 to 3500 million tonnes over the same period), especially in the use of biomass and, more recently, non-metallic minerals. This reflects broader development patterns—biomass plays a large role in Brazil’s economy, and growing use of construction materials suggests infrastructure expansion and industrial devel
To find the data yourself, you can go to the Material Flows Database, select “National 4+ categories material flows,” filter by country (e.g. Brazil), then select “MF” under flow types.
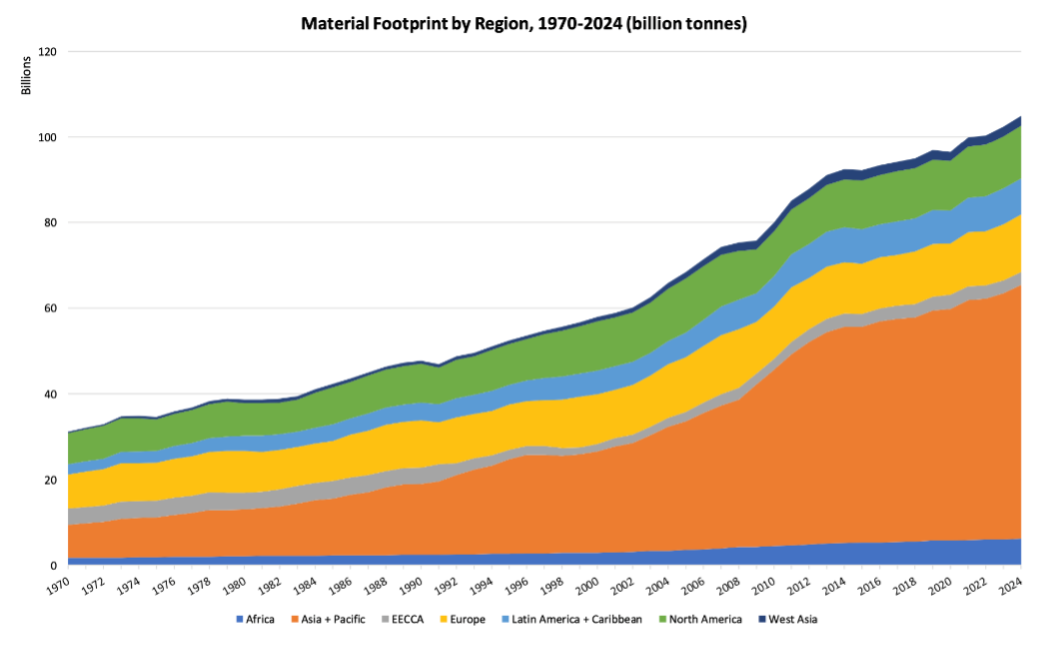
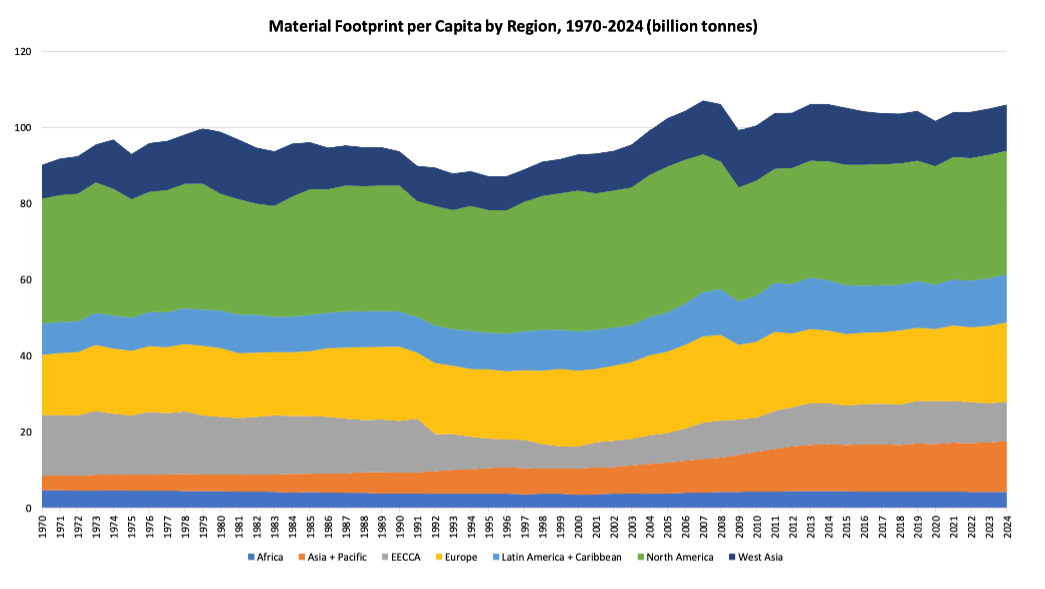
Looking at global regions and each of their material footprints, the data shows that Asia and the Pacific have seen the largest overall growth in MF in recent years. However, when adjusted for population, the picture changes. Europe and North America still have the highest material footprint per capita. This kind of comparison is useful for understanding differences in consumption patterns, both in absolute and per capita terms.
To access this, select “National material totals and ratios,” choose a region, choose MF or MF/cap under flow types to compare MF or MF per capita.
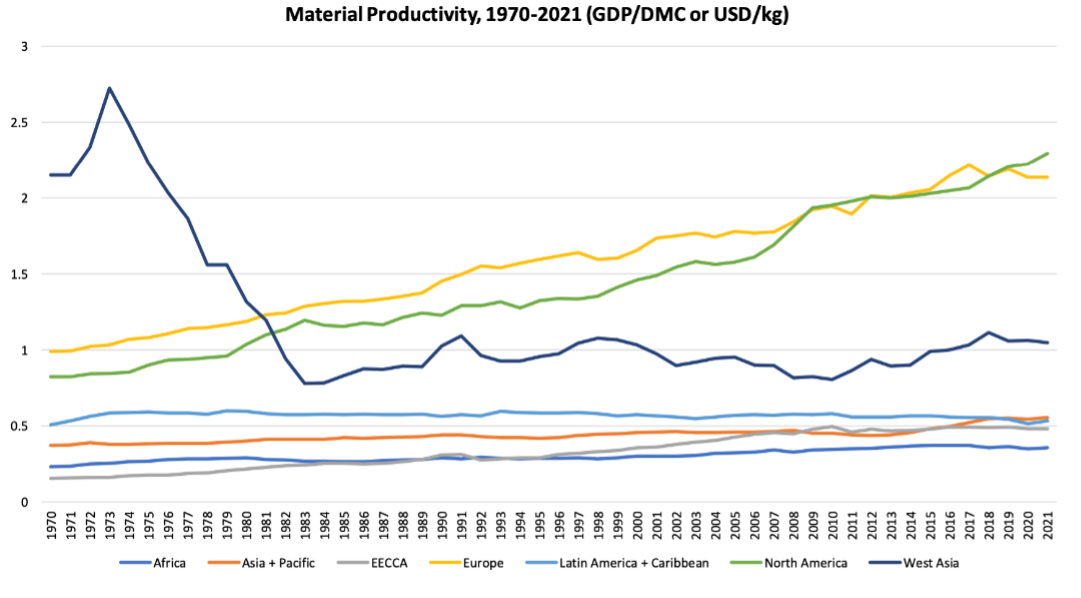
The database also includes indicators that reflect the efficiency of material use. Material Intensity (DMC per unit of GDP) helps assess how many tonnes of material are needed to produce one dollar of economic output. Over time, this has decreased in many regions, suggesting more efficient use of materials. In contrast, Material Productivity (GDP per tonne of DMC) highlights how much economic value is generated from each unit of material consumed. Europe and North America show steady increases in productivity, while other regions have followed more mixed or stagnant trends. Together, these indicators can support research on development strategies, economic transitions, and resource policy planning.
You can view these metrics under “National material totals and ratios,” then filter by region and choose either Material Productivity or Material Intensity under flow types.
Why This Matters for Students and Researchers
For students and researchers working on sustainability, development, or environmental policy, having access to reliable data is essential. The Global Material Flows Database offers a way to support arguments with concrete figures, whether you're writing a thesis, preparing a policy brief, or comparing resource use across countries. In my experience as a student intern, I found that seeing these trends laid out clearly helped me better understand the links between material use and broader social or economic outcomes. It also made the environmental impacts behind familiar issues feel much more tangible. Becoming familiar with this kind of data not only strengthens academic work but also builds the kind of analytical skills that are important for evidence-based policy and decision-making.
A Tool for the Future
Tools like the Material Flows Database make it easier to understand the relationship between resource use, economic systems, and environmental outcomes. For students, researchers, and educators, it offers a reliable and accessible way to bring data into academic work and policy discussions. I encourage anyone working in sustainability or development to explore the database and consider how it might support your research questions. If you're unsure where to start or have any trouble using it, you’re welcome to contact me. I’d be happy to help.
Author: Tara Sergeja Kadunc (IRP Intern, January - June 2025)